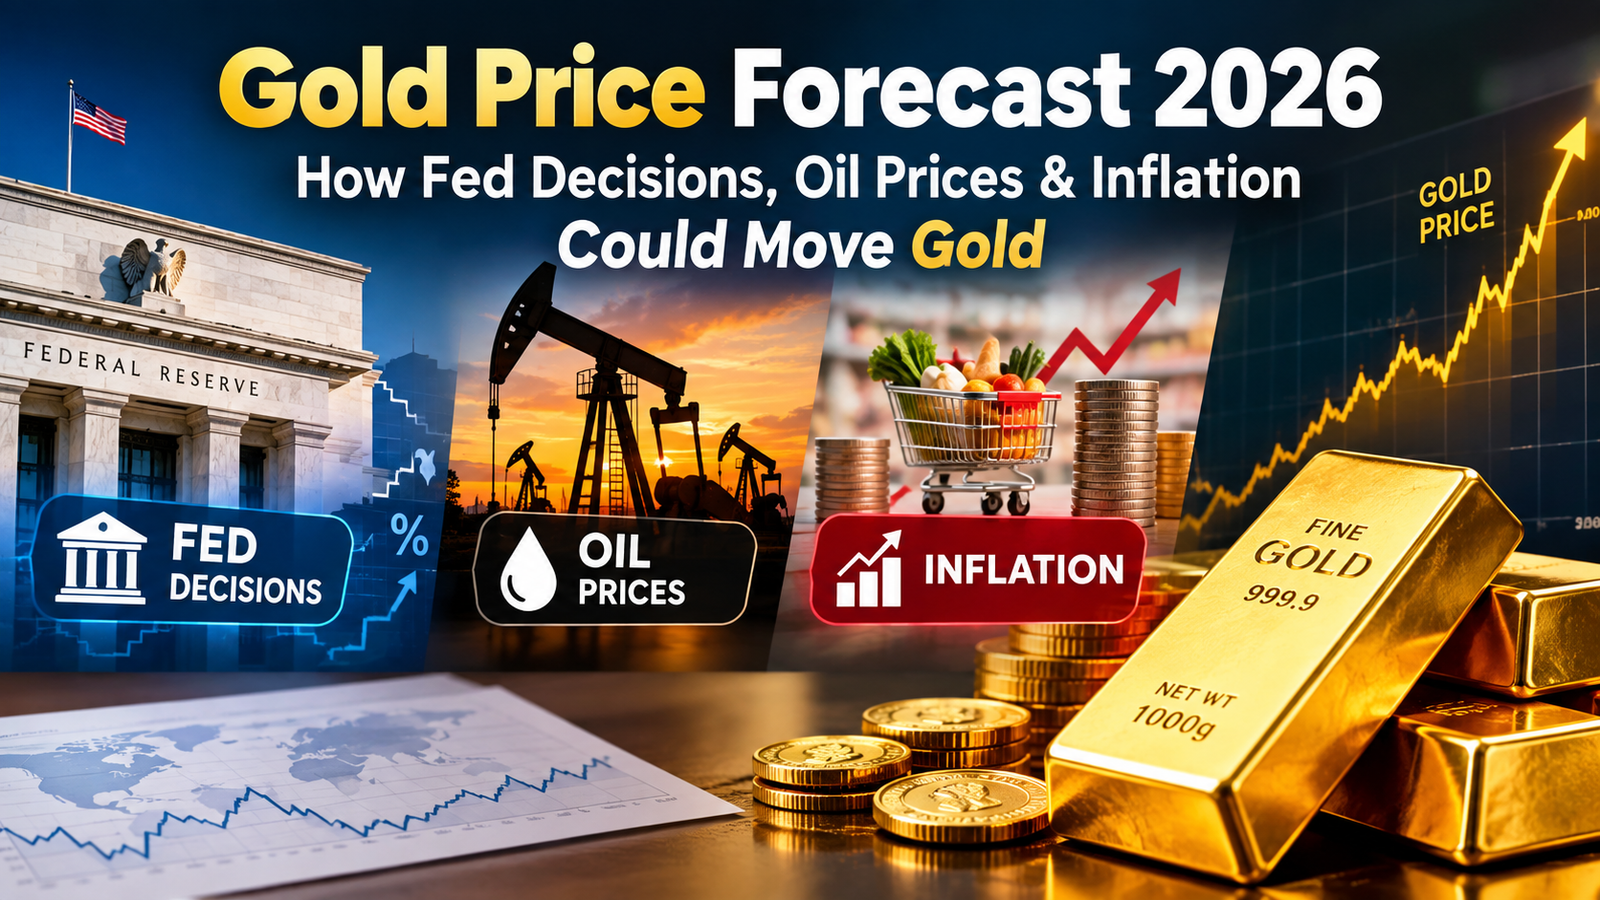
Gold Price Forecast 2026: How Fed Decisions, Oil Prices & Inflation Could Move Gold
Could an oil-price spike change how you view gold? If you’re researching the Gold Price Forecast 2026, you’re not alone. Gold responds to more than inflation headlines. Interest rates, the U.S. dollar, energy costs, investor demand, and central-bank buying can push prices in different directions.
Rather than guess one perfect target, understand the forces behind the outlook. This guide explains how Fed policy, oil, and inflation may influence gold, where to track reliable data, and how to read forecasts without overreacting. It also offers a demand signal and a scenario framework. Think of gold as a boat in shifting tides: one current can carry it forward while another pulls it back. Following the currents won’t guarantee a smooth ride, but it can help you ask better questions and recognize why forecasts change. The aim is context, not certainty; no single indicator can tell you where gold will trade next.
the outlook matters
Gold pays no interest, so bond returns and the dollar affect its appeal. In July, the Fed held rates at 3.50%–3.75% minutes. Central banks bought 289 tonnes in Q2 2026, reports the World Gold Council. Demand is supportive, not a guarantee.
How the key drivers work
Fed rates and real yields
Lower expected rates may reduce gold’s opportunity cost. Compare real yields—the inflation-adjusted bond return—and the dollar.
Oil and inflation
Oil-driven inflation can also raise rate expectations. In September, CNBC reported oil-linked hike bets weighing on gold ahead of U.S. inflation data.
Tools to monitor
Use Fed releases, BLS CPI, EIA oil reports, and WGC demand updates. CME FedWatch shows market-implied—not promised—rate odds. Compare yields and the dollar with gold.
A scenario-based strategy
Compare three cases: falling real yields and a softer dollar may support gold; mixed signals may keep it range-bound; rising yields and a stronger dollar may pressure it.
Illustrative mini-case
Hypothetical, not personal: oil spikes, but tighter-rate bets boost yields and the dollar, limiting gold. Cooler inflation may shift the balance.
Creating a credible forecast
A useful Gold Price Forecast 2026 timestamps data, cites primary sources, and labels scenarios. GoldSilver’s September outlook pairs dated prices with Fed context and demand data; useful detail, but it ages fast. A clear scenario framework lasts longer.
Three tips: Track real yields weekly; compare upside, base, and downside cases; note what would invalidate your view.
Measuring success
Review the Gold Price Forecast 2026 monthly against price and stated drivers. For SEO, track Search Console impressions, clicks, and CTR. Validate keyword volume and difficulty in an SEO tool; a 3–6-month ranking horizon is only a planning estimate.
FAQs
Will gold rise in 2026?
Uncertain; rates, the dollar, and demand can pull both ways.
How do Fed cuts affect gold?
Potentially positively, if real yields fall or the dollar weakens.
Do high oil prices always lift gold?
No; tighter-rate expectations can offset inflation fears.
What is the best gold-price indicator?
No single indicator; compare yields, the dollar, and demand.
Is gold a reliable inflation hedge?
Not always; gold can fall during inflation.
Conclusion
The Gold Price Forecast 2026 depends on interacting forces, not inflation alone. Fed decisions shape borrowing costs and real yields; oil can lift price pressures while strengthening expectations for tighter policy. The dollar, central-bank purchases, and investor demand add influences. The World Gold Council recorded 289 tonnes of central-bank buying in Q2 2026—a signal, not a promise about prices.
Use official data, compare scenarios, and update assumptions when reports arrive. Forecasts help organize questions; they are not guarantees or personal investment advice. For a step, choose one: (1) bookmark Fed, BLS, EIA, and World Gold Council data pages for a monthly review, or (2) create a tracker for real yields, the dollar, oil, inflation, and gold. If publishing an outlook, date each number and explain what would change your view. A disciplined process can make uncertainty easier to navigate, but it cannot remove market risk or predict every turn.
Suggested visual (not part of the article): A simple flow graphic showing oil prices → inflation expectations → Fed-rate expectations / real yields → gold, alongside three labeled scenarios (supportive, mixed, and pressured).