S&P 500 Forecast: Wall Street Targets Climb Above 8,000 Even as AI and Iran Risks Linger
Have you ever opened your investment account, seen the market falling, and wondered whether you should wait, buy the dip, or simply do nothing? That question is especially important for investors watching U.S. stocks in September 2026. The S&P 500 forecast has become harder to read as investors balance strong corporate earnings against rising Treasury yields, higher oil prices, inflation concerns, and renewed weakness in technology and AI stocks.
Top brokerages have raised their S&P 500 forecast for 2026, with HSBC, UBS Global Wealth Management, and Citigroup now targeting 8,100 — but the war in Iran and renewed AI jitters are testing that optimism.
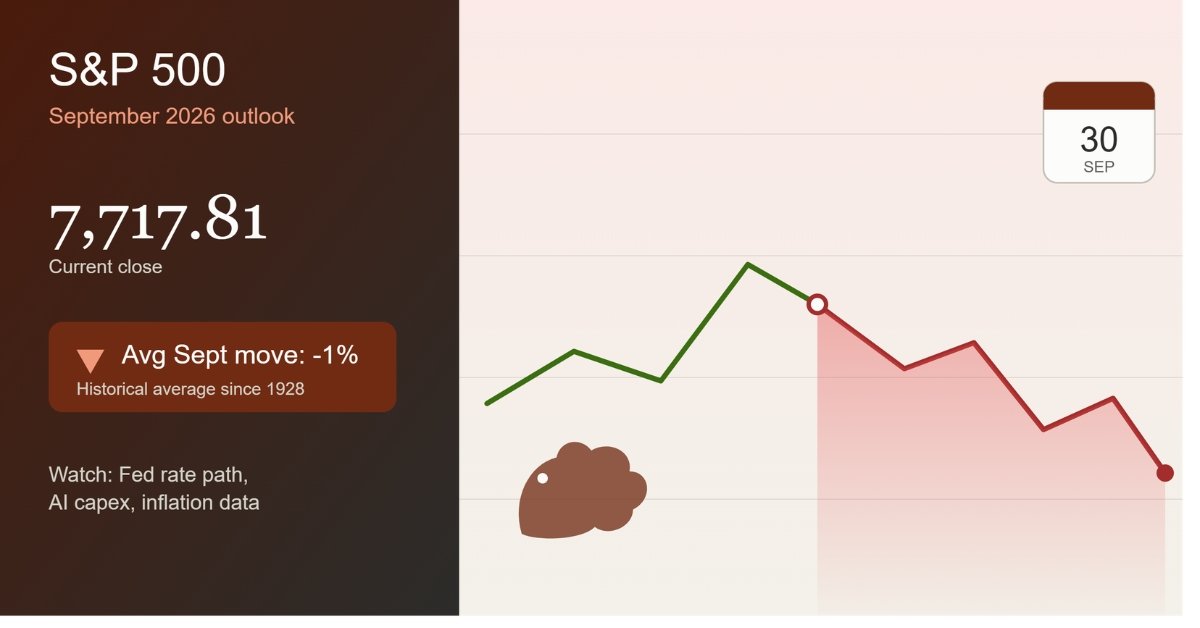
On September 14, the S&P 500 fell about 0.5% to 7,619.98, while Brent crude settled at $105.68 a barrel and the 10-year Treasury yield briefly moved above 5%. At the same time, several major semiconductor stocks experienced sharp declines. So, could stocks fall further before September ends?
Why the September S&P 500 Outlook Matters
September is an important month for investors because several market-moving factors can arrive at the same time.
Interest-rate expectations are particularly important this year. The Federal Reserve’s September meeting is taking place amid concerns about inflation and elevated oil prices. Investors are not simply watching the rate decision. They are also watching the Fed’s language and its assessment of future policy.
There is another reason this matters: valuations. When Treasury yields rise, investors have more incentive to consider relatively safer fixed-income assets. Higher yields can also increase the discount rate used when valuing future corporate earnings. That can put pressure on expensive growth stocks.
Think of the stock market like a house supported by several pillars. Corporate earnings are one pillar. Interest rates are another. Consumer spending, inflation, oil prices, and investor confidence are additional pillars. If one pillar weakens, the house can still stand. If several weaken simultaneously, volatility can increase quickly. That is why the September outlook deserves attention even though the S&P 500 remains well above its earlier levels.
S&P 500 Forecast 2026: What 19 Top Brokerages Are Actually Targeting
The table below shows where each firm stands — and the S&P 500 forecast gap between BofA’s cautious 7,100 and HSBC’s bullish 8,100 tells you how divided Wall Street really is.
Virgin Media O2 Faces £600m, Financial Losses
| Brokerage | 2026 S&P 500 Index Target |
|---|---|
| BofA Global Research | 7,100 |
| Jefferies | 7,500 |
| Canaccord Genuity | 7,500 |
| BNP Paribas | 7,500 |
| Evercore ISI | 7,750 |
| Seaport Research Partners | 7,800 |
| RBC Capital Markets | 7,900 |
| Wells Fargo | 7,950 |
| Barclays | 7,950 |
| J.P. Morgan | 8,000 |
| Deutsche Bank | 8,000 |
| Societe Generale | 8,000 |
| Goldman Sachs | 8,000 |
| Morgan Stanley | 8,000 |
| UBS Global Research | 8,100 |
| Oppenheimer Asset Management | 8,100 |
| Citigroup | 8,100 |
| UBS Global Wealth Management | 8,100 |
| HSBC | 8,100 |
| Wells Fargo Investment Institute | 7,800–8,000 |
UBS Global Research and UBS Global Wealth Management are distinct, independent divisions within UBS Group. Wells Fargo Investment Institute is a wholly owned subsidiary of Wells Fargo Bank.
The S&P 500 dropped 0.8% to 7,656.98 in the week ending September 11, 2026, falling 1.8% below its record high from August. Inflation remained steady with the Consumer Price Index at 3.4%, prompting the CME Group’s FedWatch Tool to predict four more quarter-point rate hikes by the Federal Reserve. Meanwhile, the Atlanta Fed lowered its GDP growth forecast for Q3 2026 to 4.4% from 4.7%.
What Is Driving the Market Right Now?
Rising Treasury Yields
The 10-year Treasury yield briefly exceeded 5% on September 14 before moving lower. It was the first time since 2023 that the benchmark yield crossed that level intraday. That matters because Treasury yields influence borrowing costs throughout the economy. Higher yields can make mortgages, corporate borrowing, and other forms of financing more expensive. They can also change how investors value high-growth companies.
For stock investors, the key question is not simply whether yields are high. It is whether they remain high for longer than expected.
Oil Prices Are Adding Inflation Pressure
Brent crude settled at $105.68 per barrel on September 14 after approaching $110 earlier in the session. Higher energy prices can feed into transportation, manufacturing, and consumer costs. If inflation remains stubborn, the Federal Reserve may have less flexibility to ease monetary policy. That creates a difficult environment for equities.
AI and Semiconductor Stocks Are Under Pressure
Technology has been one of the major engines of the U.S. stock market. But the AI trade has recently experienced renewed volatility.
On September 14, Nvidia fell 3.4%, Micron dropped more than 5%, while Broadcom and AMD each declined more than 4%. The Philadelphia Stock Exchange Semiconductor Index fell 5.9% and has now dropped more than 20% from its June high.
This is important because technology companies have a significant influence on major U.S. indexes. If large technology stocks fall sharply, the S&P 500 can feel the impact even when other sectors remain relatively stable.
AI Momentum Is Still the Backbone of Every Bullish S&P 500 Forecast
Barclays lifted its S&P 500 forecast to 7,950 on September 9, citing AI-led earnings strength — the same theme running through J.P. Morgan, Deutsche Bank, and Goldman Sachs targets.
Anthropic CEO Dario Amodei published an essay titled “We Must Pace the Frontier,” urging AI firms to slow development. OpenAI’s Sam Altman and xAI’s Elon Musk both agreed. Chip and AI-linked shares across Asia sold off hard in response, and that headline still hangs over how the S&P 500 trades this week.
Takayuki Miyajima, senior economist at Sony Financial Group, said “selling pressure is likely to hit AI and semiconductor-related stocks in Tokyo.” Charu Chanana, chief investment strategist at Saxo Markets, offered a different read: added safety measures could still support spending on cybersecurity and AI monitoring tools.
Whether that pressure spreads into the wider S&P 500 or stays confined to AI-linked names is still an open question.
Why This Week’s Fed Decision Could Break the S&P 500 Forecast
With fed funds futures now pricing an 86% chance of a 25-basis-point hike, the S&P 500 forecast faces its biggest near-term test since the August record high.
The Fed has held its rate at 3.50% to 3.75% since its last cut in December 2025. Pricing has swung toward a hike as the likelier outcome, with CME FedWatch-tracked odds above 50% since Chair Kevin Warsh’s hawkish Jackson Hole tone in August. That’s a different setup from earlier in the year — and it’s why this week’s volatility deserves more attention than the quiet 0.07% move suggests.
Could the S&P 500 Fall Further?
Yes, a further pullback is possible. But that does not automatically mean a major crash is coming.
One recent technical analysis suggested the S&P 500 could move toward approximately 7,500 by the end of September if current weakness continues. The analysis also identified the 7,500 area as an important potential support zone. That scenario would represent a correction rather than proof of a long-term bear market.
The Technical S&P 500 Forecast: 7,500 Support, 7,679 Resistance
Technical analysts are watching 7,500 as the key downside level in their S&P 500 forecast, while the 50-period moving average near 7,679 caps the upside for now.
The hourly chart tells a two-part story across the past ten sessions. The index fell from a high near 7,760 in early September to a low around 7,600 by September 10, with the RSI briefly dropping below 20 — an oversold reading. Buyers stepped back in fast, rallying into September 11 and 12 and retesting the 50-period moving average near 7,679.43 before easing off. As of the cut-off, price sits at 7,632.22, just under both the 50-period average (7,679.43) and the 200-period average (7,638.75) — a setup chart-watchers usually call consolidation rather than trend.
Momentum has cooled alongside the pullback. The 14-period RSI reads 44.95, below its own 56.33 moving average.
The Bearish S&P 500 Forecast: What Happens If 7,500 Breaks
The bearish S&P 500 forecast hinges on three things happening together: yields staying above 5%, oil holding above $100, and chip stocks extending their 20% decline.
Add a hawkish Fed and weakening earnings guidance, and selling pressure could accelerate. RBC Capital and Deutsche Bank joined J.P. Morgan, Citadel, and Wells Fargo in cautioning investors, citing factors ranging from September seasonality to the rate environment and the sustainability of the AI boom.
The Bullish Case
The opposite scenario is also possible. If oil prices decline, Treasury yields stabilize, inflation becomes less concerning, and corporate earnings remain strong, investors could return to risk assets. That would make a September pullback look more like a temporary pause than a major trend reversal.
There is already evidence supporting the bullish argument. 86% of 492 S&P 500 companies that had reported second-quarter results exceeded analyst earnings estimates, compared with a long-term average of 67.5%, according to LSEG data cited by Reuters. That is a powerful reminder that market weakness does not necessarily mean corporate fundamentals have collapsed.
Proven Strategies for Handling Market Volatility
There is no strategy that eliminates investment risk. However, investors can reduce emotional decision-making.
1. Avoid Making Decisions From One Red Day
A single market decline does not tell you where the market will be next month. Look at the broader trend. Ask whether the decline is being caused by changing fundamentals or temporary sentiment.
2. Build a Watchlist Instead of Chasing Prices
Create a list of companies or ETFs you understand. Then define what would make you interested in buying. For example: better valuation, strong earnings, improving guidance, lower interest rates, or stabilizing technical conditions. This is better than buying simply because a stock is falling.
3. Use Dollar-Cost Averaging for Long-Term Goals
Long-term investors may prefer investing a fixed amount regularly rather than trying to predict the exact market bottom. The advantage is psychological as well as financial. You do not have to answer the impossible question: “Is today the bottom?” Instead, you follow a predetermined plan.
4. Manage Risk Around Event-Heavy Weeks
Weeks combining a Fed decision with a sector shock tend to bring wider intraday ranges. A stop loss placed with that context in mind — rather than assuming typical ranges will hold — is worth a second look before Wednesday. Traders holding positions tied to AI or semiconductor themes alongside broad index exposure may also want to check their combined exposure, since these moves have shown up across markets together.
Leverage on index CFDs works both ways: it can amplify gains just as easily as losses. Position sizing relative to account equity is worth revisiting ahead of the FOMC decision on September 16, given the wider ranges a week like this can bring.
S&P 500 Forecast: Bullish and Bearish Scenarios
The current market offers a genuine debate rather than an obvious answer.
| Factor | Potentially Bullish | Potentially Bearish |
|---|---|---|
| Corporate earnings | Strong results (86% beat rate) | Earnings slowdown |
| AI investment | Continued growth | AI spending concerns |
| Treasury yields | Falling yields | Yields above 5% |
| Oil prices | Falling energy costs | Oil above $100 |
| Fed policy | More supportive | More hawkish (86% hike odds) |
| Inflation | Cooling (CPI at 3.4%) | Persistent |
| Investor sentiment | Risk appetite returns | More defensive positioning |
This balanced approach is important. Barclays remains constructive because of earnings strength and AI investment, while also warning about valuations, inflation, geopolitical uncertainty, and interest-rate risks.
That tells us something important: the market can have strong long-term fundamentals while still experiencing short-term corrections.
A Practical Example
Imagine an investor who has $20,000 invested in a broad S&P 500 index fund. The market falls 5%. The investor immediately sells everything because the headlines sound frightening. A month later, the market rebounds. The investor now has a difficult decision: buy back at a higher price or remain in cash.
A different investor follows a predetermined allocation plan and continues adding gradually. Neither investor can predict the future. But the second investor has removed one major risk: making an emotional decision based on a single market move. This is why having a process can be more valuable than having a perfect forecast.
FAQ
1. What is the current S&P 500 forecast for the end of 2026?
Wall Street is split. The most bullish S&P 500 forecast comes from HSBC, UBS Global Wealth Management, and Citigroup — all targeting 8,100. The most cautious is BofA Global Research at 7,100. The median across 19 major brokerages sits around 7,950, which implies roughly 4% upside from the September 13 close of 7,632.22. That gap tells you something important: even the professionals disagree by more than 1,000 points.
2. Why did brokerages raise their S&P 500 forecast in September 2026?
Two reasons. First, AI-led earnings strength — Barclays lifted its S&P 500 forecast to 7,950 on September 9, specifically citing standout results from technology and AI-linked companies. Second, 86% of 492 S&P 500 companies beat Q2 earnings estimates, well above the 67.5% long-term average. Strategists are betting that AI momentum will outweigh the short-term drag from the Iran conflict and elevated oil prices.
3. Could the S&P 500 forecast be wrong if the Fed hikes rates this week?
Absolutely. The S&P 500 forecast assumes a relatively stable rate environment. But fed funds futures now price an 86% chance of a 25-basis-point hike at the September 16 FOMC meeting — up sharply from 59% the prior week. If the Fed hikes and signals more to come, the 10-year Treasury yield could push back above 5%, which would pressure growth stocks and likely force strategists to revise their targets lower.
4. What technical levels matter most for the S&P 500 forecast right now?
Two levels dominate the short-term S&P 500 forecast. On the downside, 7,500 is the key support zone — a break below could open the door to a deeper correction. On the upside, the 50-period moving average near 7,679 is the first resistance. The RSI sits at 44.95, below its moving average, which suggests momentum has cooled but isn’t oversold. Until price clears 7,679, chart-watchers will treat this as consolidation, not a new uptrend.
5. Should long-term investors change their strategy based on the S&P 500 forecast?
Not necessarily. The S&P 500 forecast matters most for traders and short-term allocators. For long-term investors, the more useful question is whether corporate earnings — the foundation of any forecast — remain intact. Right now, they do. Strong Q2 results, continued AI capex, and stable consumer spending suggest the bull case is still alive. A 5–10% pullback wouldn’t invalidate that. What would? A sustained earnings slowdown, not a single red week.